


filmQA pro™ comparison sensitivity tool
Tool to quantify how sensitive the comparison passing rate results with respect to specific distortions of the signal like registration errors, distortion in in the dose map caused by calibration errors. Trend of such sensitivity with respect to other properties (e.g. signal noise and image resolution) can be determined. This tool allows to select the best comparison mapping and paramets so that the change of passing rate is maximized when certain error occur, i.e. to find the most sensitive comparison configuration.
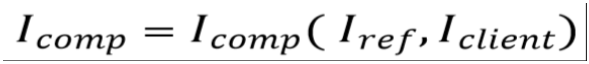
The result of a comparison of two images Iref (e.g. plan) and Iclient (e.g. measured dose map) using comparer like ΔDnorm , ΔLnorm and γnorm (see Gamma Analysis) is an image Icomp having the same size as Iref.
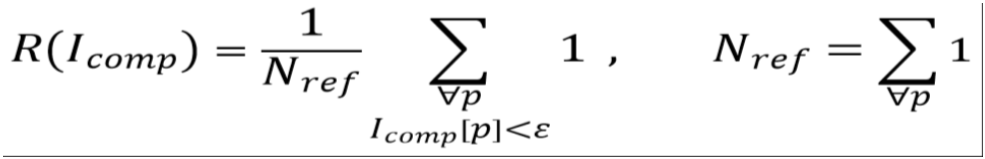
To compact the comparison often single characteristic numbers Kcomp.are used to describe the achieved result. Examples for such characteristic numbers Kcomp.are the passing rate
or average comparison value
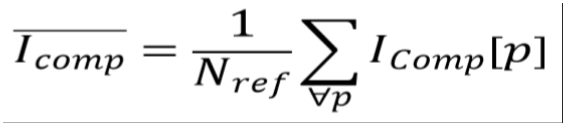
therein Nref is the total number of image pixels of the comparison map Icomp.
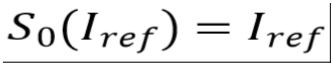
Distorting the reference image Iref by a parameterized process Ss where s≥0 is the process parameter and for s=0 the process is the identity, i.e.
When using as client image for the comparison
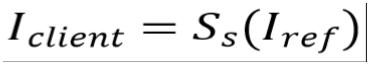
the sensitivity σcomp becomes
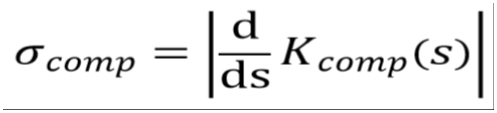
with

The sensitivity σcomp can be approximated by difference formula using
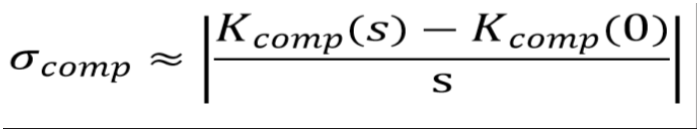
The higher the sensitivity σcomp the more the characteristic number Kcomp will change and allow to recognize any distortion more significantly.
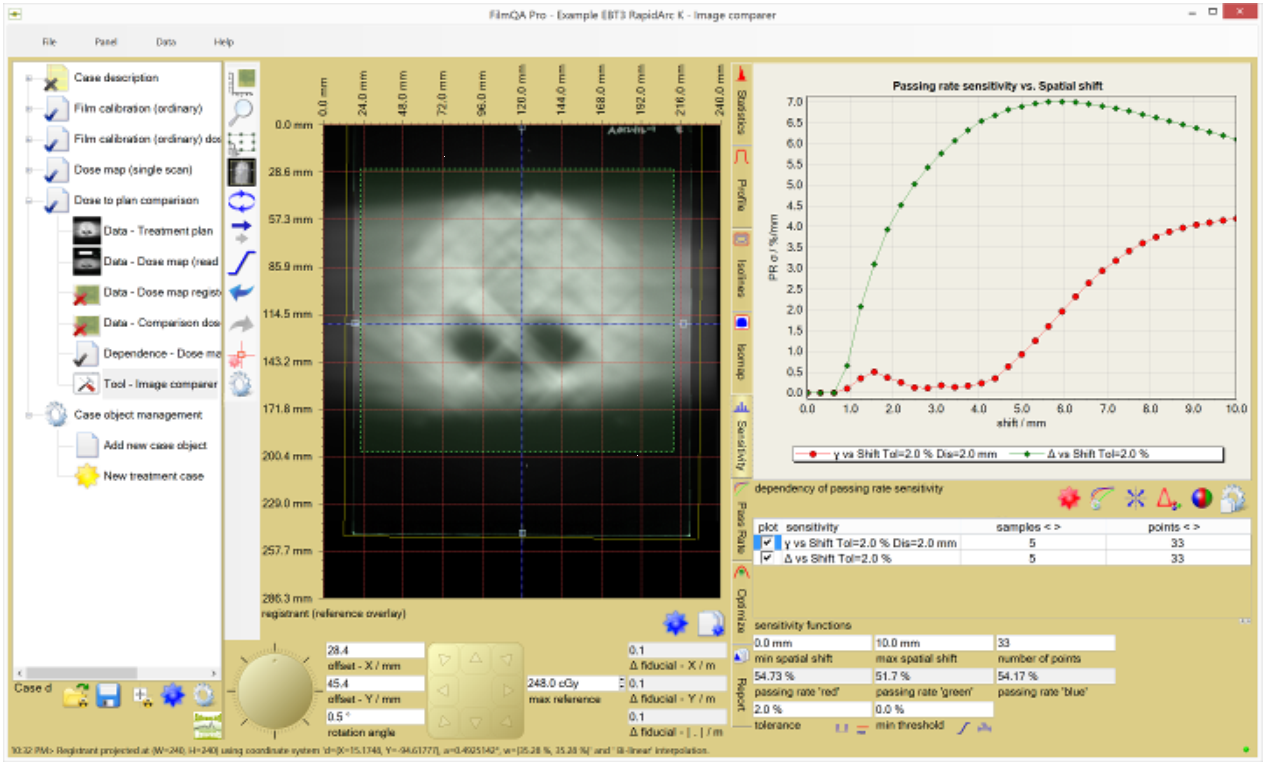
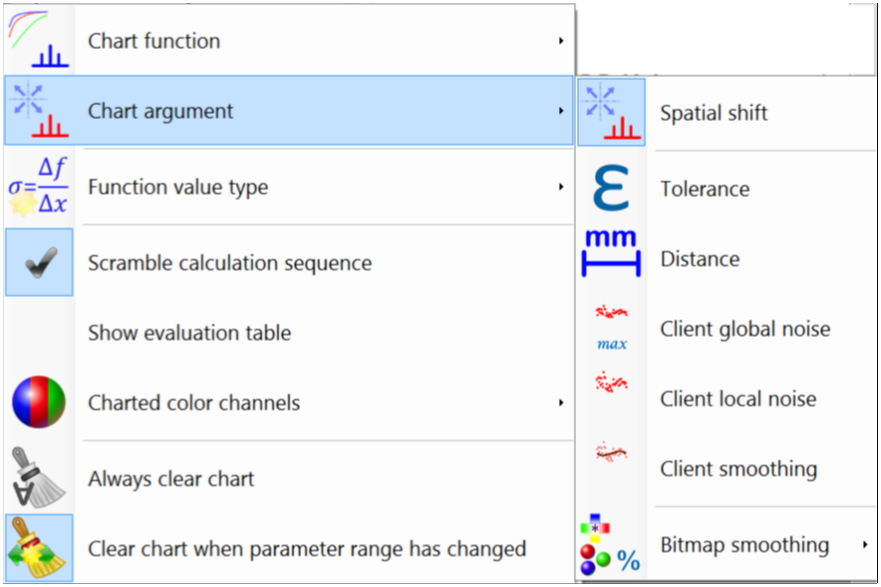
To carry out a sensitivity analysis for a comparison select the ’sensitivity’ tab in the image comparison tool. By default the sensitivity with respect to spatial shifts (registration error) is calculated as shown below both for differential map and gamma map comparison.
- Click the
 button to select the type of distortion used to calculate the comparison sensitivity.
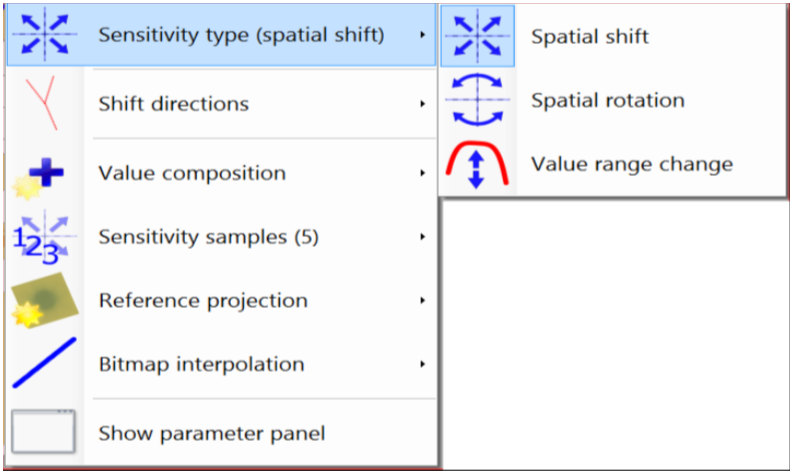
- Spatial shift: Position of client image is shifted at specified shift direction.
- Spatial rotation: Cliient image is rotated arounf specified rotation pole.
- Value range change: Client image values are rescaled using specified range change.
- Value composition: Method used to combine comparison values of different color channels.
- Sensitivity sample: Number of samples (comparison maps) used for each parameter value to approximate the sensitivity. Sample values are averaged. Sample number is adjusted if number of variations are limited (e.g. for spatial rotation only two directions are possible). The total number of calculated comparison maps is sample number * number of chart points. The required computation time is proportional to that number!
- Reference projection: Method to generate client image for comparison.
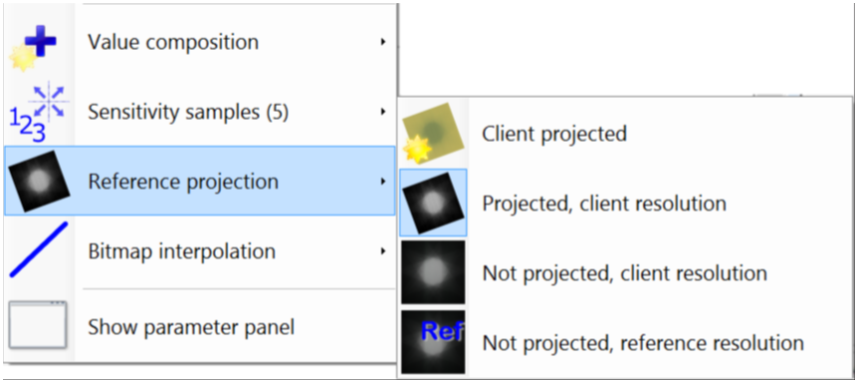
- Not projected, reference resolution: Reference image is used as is.
- Not projected, client resolution: Reference image is interpolated to client resolution.
- Projected, reference resolution: Reference image is projected to client coordinates (reverse registration transformation) and interpolated to client resolution.
- Client projected: Client image and registration transformation are used as they are.
- Bitmap interpolation: Interpolation method to generate client images with resolution different from that of the reference image.
Use the  button or right click the chart area to configure chart settings.
The following comparison sensitivity values can be determined:
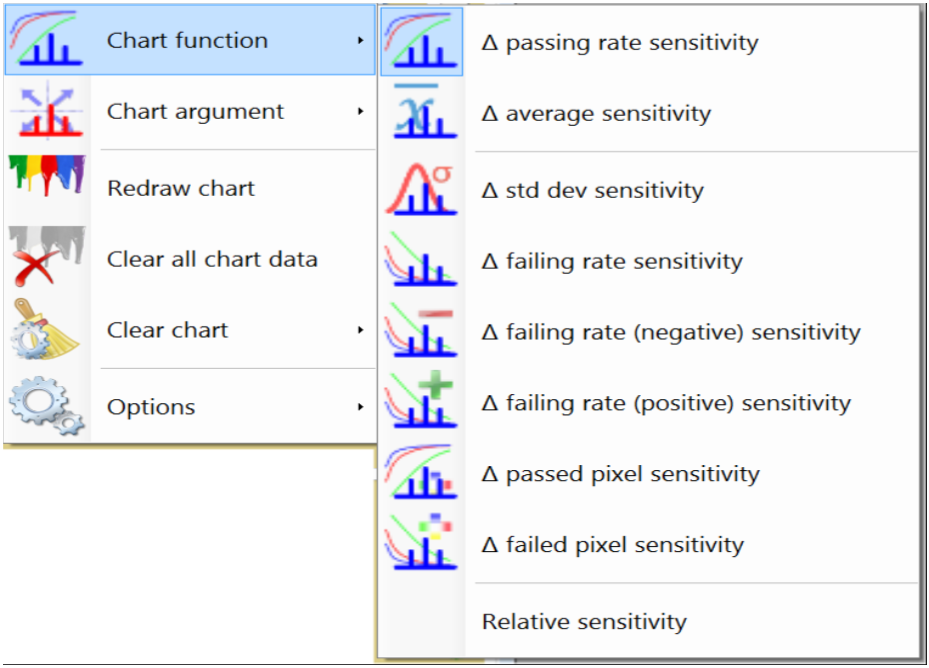
- Passing rate sensitivity: Sensitivity with respect to ratio between number of pixels that passed the test criterion and total number of tested pixels.
- Average sensitivity: Sensitivity with respect to average of the comparison map values.
- Std dev sensitivity: Sensitivity with respect to standard deviation of the comparison map values.
- Failing rate sensitivity: Sensitivity with respect to ratio between number of pixels that failed the test criterion and total number of tested pixels. Failing rate = 100% - passing rate.
- Failing rate (negative) sensitivity: Sensitivity with respect to ratio between number of failed pixels with value below the reference and total number of tested pixels.
- Failing rate (positive) sensitivity: Sensitivity with respect to ratio between number of failed pixels with value above the reference and total number of tested pixels.
- Passed pixels sensitivity: Sensitivity with respect to number of pixels that passed the test criterion.
- Failed pixels sensitivity: Sensitivity with respect to number of pixels that failed the test criterion. Failed pixels = total number of tested pixels - passed pixels.
The above comparison sensitivity values can calculated from the same comparison data and a plot will not require any comparison map calculation.
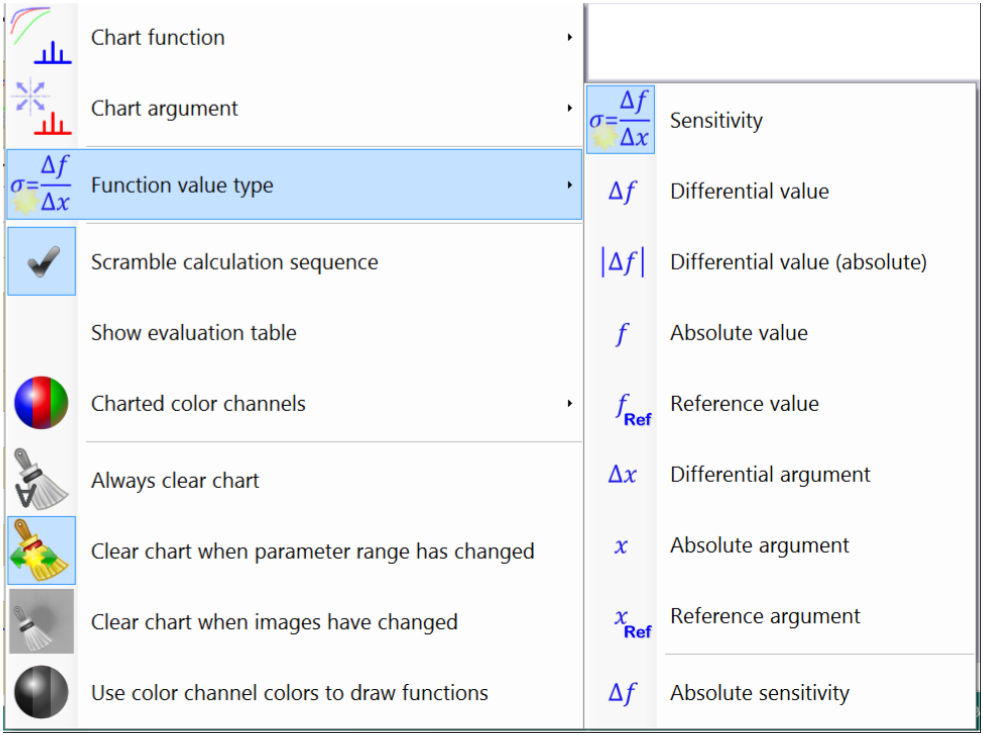
The following function values can be charted:
- Sensitivity: Sensitivity σcomp as described above.
- Differential value: Difference Kcomp(s) - Kcomp(s0).
- Differential value (absolute): Absolute difference |Kcomp(s) - Kcomp(s0)| .
- Reference value: Reference Kcomp(s0).
- Differential value: Difference s - s0 .
- Reference argument: Reference argument s0 .
The comparison sensitivity can be calculated as function of the following parameters:
- Spacial shift - Sensitivity type: Image distortion operator Ss is applied for various values s to calculate the comparison sensitivity.
- Tolerance: Test tolerance of the comparison used to let a specific pixel pass or fail.
- Distance: Test distance for comparison maps that uses ‘Distance to agreement’ search. Only available for comparison maps with such search (e.g. not available for differential delta comparison).
- Relative minimum threshold: Relative minimum threshold to exclude lower dose values from the comparison.
- Reference resolution: Resolution of the reference image (plan).
- Client resolution: Resolution of the client image (dose map). Note most comparisons in FilmQA Pro use the projection of the client image to the grid of the reference image (plan) to reduce the dependency on noise—see Gamma Analysis.
- Client absolute noise: Varies the noise added to the client image (dose map). The added noise is equi-distributed in a range proportional to the maximum value (global or absolute).
- Client relative noise: Varies the noise added to the client image (dose map). The added noise is equi-distributed in a range proportional to the local client value (local or relative).
- Client smoothing: Varies the smoothing of the client image (dose map) using a convolution filter that can be selected at “Client smoothing”. Additional concolution filters can be defined in the image viwer and editor tool.
The following options can be selected to control how the chart is updated:
- Always clear chart: Chart is always cleared before new function is plotted (only single function shown).
- Clear chart when parameter range has changed: When parameter range for x axis changes the chart is cleard (only function across same range are plotted).
- Clear chart when images havee changed: When reference image or client image change the chart is cleared .
Note that comparison sensitivity depends strictly on the reference image (plan) used.
Read More >